Solution:
Ans:
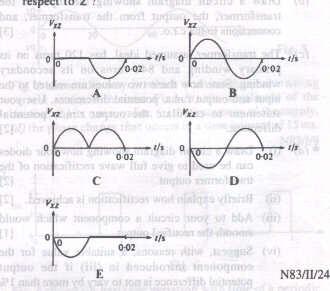
A
When
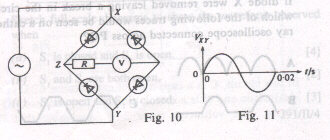
potential across X is positive with respect to Y, current is flowing from
X to Y, thus path of current is from X to Z then through the resistor and
voltmeter to Y. And there is no potential difference between X and Z (forward
bias, resistance of diode is negligible). Therefore when the potential
across X is positive with respect to Y, there is no potiential difference
between X and Z. Thus answer B, C, D, E is not correct. When the potential
across X is negative with respect to Y, current will move from Y to Z then
through the resistor and voltmeter and to X. Thus Z is at higher potential
then X, and the graph of potential of X with respect to Z, when potential
of X with respect to Y is negative, is negative.
Back  Continue Continue
|